- 1.0 Introduction: As bio 2026 Draws Near, Why EHA 2026 Will Be the Key Barometer for a Global Paradigm Shift in Hematology
- 2.0 bio 2026 Perspective: Global CGT in the First Half of 2026 — Reconstructing Consensus from Wealth Myths to a Commercial Ice Age
- 3.0 From bio 2026 to EHA 2026: Three Core Technology Tracks (The Most Cutting-Edge Content)
- 4.0 Cross-Industry Convergence at bio 2026 and Beyond: Imagining the Combination Strategies for 2026–2028
- 5.0 Practical Guide: How to Navigate EHA 2026 and bio 2026 Effectively to Capture High-Value Signals
- 6.0 bio 2026 Conclusion: The Second Half of the Golden Age of Hematology — Defining Success Through Scalable Accessibility
- 7.0. bio 2026 Frequently Asked Questions (FAQ)
EHA 2026 Stockholm: Six Key Decision Maps for a New Era in Hematology
An In-Depth Conference Guide for Clinicians, R&D Leaders, Investors, and Chinese Biotech Companies
1.0 Introduction: As bio 2026 Draws Near, Why EHA 2026 Will Be the Key Barometer for a Global Paradigm Shift in Hematology
As bio 2026 convenes in Boston, global hematology stands at a rare historical inflection point. This is not due to the launch of a single drug or the completion of a Phase III trial for a particular pipeline, but because the underlying logic of the entire industry is being rewritten. The “golden decade” driven by the belief in efficacy above all else is coming to an end at a visible pace, following the successive commercial failures of CAR-T products priced in the millions of dollars.Replacing it is a new era defined by industrial feasibility, payment accessibility, and regulatory clarity.

Against this backdrop, the European Hematology Association (EHA) Annual Congress 2026, to be held in Stockholm, Sweden, in June 2026, carries significance far beyond that of a mere academic gathering. It marks the first major occasion—following three years of commercialization challenges—where the global hematology industry will publicly address the critical junctures in technological pathways, with industry restructuring as the central theme.Institutions such as the University of Pennsylvania, Dana-Farber Cancer Institute, Beam Therapeutics, and Graphite Bio will present their latest assessments of technological directions for the next five years; the gene editing safety guidelines intensively released by the FDA and EMA in the first half of 2026 will also undergo their first large-scale academic review here.
1.1 The Dual-Peak Status of EHA and ASH, and the Unique Significance of Europe (Stockholm) as a Testing Ground for Industry Self-Rescue and Transformation in 2026
In the global academic landscape of hematology, the EHA (European Hematology Association Annual Congress) and ASH (American Society of Hematology Annual Meeting) are regarded as twin peaks, each with its own focus and complementing one another. ASH is held annually in December in the United States and has traditionally served as the main stage for North American biotech companies to showcase their presence and announce Phase III data; meanwhile, as Europe’s premier hematology conference, EHA primarily showcases translational research, real-world evidence (RWE), and regulatory pathway exploration from European academic institutions.
The 2026 EHA is particularly noteworthy due to the geographical and industrial significance of Stockholm. The academic depth of the Nordic region in the field of cell and gene therapy far exceeds public perception: Sweden’s Karolinska University Hospital was one of the first institutions globally to conduct allogeneic CAR-T clinical trials, while gene editing clinical research in Denmark and Finland has accumulated a wealth of real-world safety data under the European Medicines Agency (EMA) framework.More importantly, the unique structure of Europe’s public healthcare systems—including a unified drug pricing negotiation mechanism and relatively comprehensive patient follow-up databases—ensures that the quality and credibility of RWE far exceed those of the fragmented private systems in the United States.
This means that EHA 2026 will serve as the first global industry forum to use European data validation as its core logic for testing the commercial viability of next-generation cell and gene therapy technologies. For Chinese biotech companies seeking a global entry point, understanding the framework for interpreting EHA data is key to planning international business development strategies with minimal trial-and-error costs.
In terms of topic distribution, the three key focus areas of EHA 2026 are already evident in the number of abstracts: abstracts related to in vivo reprogramming have increased by approximately 40% compared to 2024; long-term follow-up (LTFU) data on gene editing safety is one of the subfields with the highest proportion of oral presentations this year; and the number of abstracts on ADC and bispecific antibody combination therapies has surpassed those on CAR-T alone for the first time.These three signals outline the primary battlegrounds for competition in the hematology industry from 2026 to 2028.
Table 1-1: Core Comparison of EHA vs. ASH
| Comparison Dimensions | EHA (European Hematology Association) | ASH (American Society of Hematology) |
| Date | June of each year | Every December |
| Venue | Rotating among European cities (2026: Stockholm) | Rotating U.S. cities (2025: San Antonio) |
| Academic Focus | European translational research, real-world evidence (RWE), and regulatory pathway exploration | North American Phase III clinical data, new drug launches, industry business development |
| Regulatory Context | EMA framework, public healthcare system, centralized pricing negotiations | FDA framework, private insurance, market-based pricing |
| Value of Chinese Biotech | Validate global data, expand European MRCT collaborations | Establishing a presence in the U.S. market, seeking U.S. business development partners |
| Special Value in 2026 | First time focusing on industry restructuring as the main theme, testing in vivo feasibility | (Reference) |
From the perspective of data quality, EHA’s European data possesses unique and irreplaceable advantages. Follow-up data for European patients is more comprehensive, which is particularly critical in LTFU studies—the risks of secondary tumors and clonal hematopoietic signals associated with gene editing therapies often require 3–5 years or even longer of follow-up to manifest.Patients in Europe’s public healthcare systems do not discontinue follow-up due to financial constraints, making EHA’s LTFU data statistically more compelling.
For China’s biopharmaceutical industry, the significance of the EHA also lies in bridging regulatory information gaps. The regulatory pathways of the EMA and FDA in the field of CGT differ significantly: the EMA tends to favor early conditional marketing authorization followed by supplementary real-world evidence (RWE); the FDA, however, places greater emphasis on the completeness of pre-market data. Understanding the EMA’s logic holds immense strategic value for Chinese biotech companies aiming to pursue a strategy of entering the European market first and the U.S. market later.
1.2 Core Industry Shift: From the “Efficacy-First” Frenzy to a Post-Frenzy Era Driven by Industrialization, Accessibility, and Reimbursement
The period from 2015 to 2022 marked the first golden era of the global CGT industry. CAR-T products such as Kymriah, Yescarta, and Breyanzi were successively approved, while Bluebird Bio’s gene therapy for sickle cell disease offered a glimpse of the possibility of a functional cure.Capital markets expressed their collective faith in this direction through valuations in the hundreds of billions of dollars. Efficacy data was the ultimate currency of this era—as long as overall survival (OS) and complete remission (CR) rates were sufficiently impressive, valuation, pricing, and accessibility were secondary concerns.
But starting in 2023, this logic began to unravel. Bluebird Bio sold off its business and delisted; 2seventy bio’s bb2121 (Abecma) performed far below market expectations; and Orchard Therapeutics faced reimbursement rejections from multiple European healthcare systems due to the $3.5 million price tag of its ADA-SCID gene therapy. Ultimately, the common commercial fate of these pioneering products was that while efficacy existed, payment barriers remained insurmountable.
By Q1/Q2 of 2026, a clear consensus had emerged across the global industry: competition in the next generation of CGT is no longer solely about clinical data, but rather a comprehensive competition involving manufacturing costs, production cycle (vein-to-vein time), and payment accessibility. The true winner will be whoever can transform an effective treatment into one that is accessible and affordable for the general patient population.
Table 1-2: Comparison of Core Characteristics Across Two Development Stages of the CGT Industry
| Era Characteristics | Phase 1 (2015–2022): Efficacy Frenzy | Phase 2 (2023–2026): Post-Frenzy Restructuring Phase |
| Core Metrics | Clinical endpoints such as CR rate, OS, PFS, etc. | Manufacturing costs, vein-to-vein ratio, accessibility, reimbursement success rate |
| Pricing Logic | Efficacy premium, over $1 million | Outcomes-based payment, staged payments |
| Technology preferences | Autologous CAR-T, AAV gene therapy | Allogeneic, In Vivo, Base/Prime Editing |
| Failed Cases | Bluebird Bio delisted, 2seventy bio scaled back operations | Orchard Therapeutics Pricing Crisis |
| Regulatory Trends | Accelerated Approval, Priority Review | Strengthened LTFU Requirements and Issuance of Gene Editing Safety Guidelines |
| Investment Rationale | Pipeline Size and Clinical Data Drive High Valuations | Manufacturing Platforms, Accessibility Strategies, and LTFU Data Create Differentiation Barriers |
This shift is already clearly reflected in the abstract selection for EHA 2026. Among the abstracts selected for oral presentations this year, over 35% explicitly include manufacturing cost analysis, accessibility models, or reimbursement pathway design—a proportion that was virtually zero prior to 2022. The topic selection trends at academic conferences often reflect the industry’s true direction earlier than valuation fluctuations in the capital markets.
For attendees, understanding this shift has practical value: when you see exciting early-stage in vivo CAR-T data in the EHA 2026 poster session, the first question you should ask is not what the response rate is, but rather: what is the manufacturing cost of this delivery system? Can it be produced at scale? Can health insurance cover it? This is the correct framework for assessing the true commercial value of a pipeline in 2026.
1.3 The Core Value of This Article: A Decision-Making Roadmap, Not an Agenda Summary
From the outset, this article was not intended to provide you with a summary of the EHA 2026 agenda. The agenda is public information that anyone can download for free at ehaweb.org.This article attempts to do something more difficult—and more valuable: to help you establish a systematic framework for evaluation before, during, and after the conference. This framework will enable you to identify truly important signals amidst a deluge of information, filter out PR-driven noise, and translate these insights directly into concrete actions in clinical practice, R&D, and investment.
The typical reader of this article should fall into one of the following categories:
① Hematology-oncology clinicians who want to know, before the conference, which pipeline data will truly change existing treatment guidelines;
② R&D leaders at biotech companies who need to decide whether to shift resources to in vivo platforms or assess the feasibility of international business development for existing pipelines;
③ Investors in the life sciences sector who are evaluating their next investment strategy and need to translate EHA data into investment decisions;
④ Business development leads at Chinese or Asian biotech companies seeking European partners or MRCT opportunities;
⑤ Regulatory affairs specialists who need to track the EMA’s latest stance on the safety of gene editing.
This article will not provide you with a quick-read list of the top ten must-see highlights from EHA. That kind of content is available in any medical media outlet and often becomes outdated within three days of the conference’s conclusion. What this article offers is an analytical framework that will remain relevant for 12 to 18 months, allowing you to refer back to these insights during your future investment decisions, BD negotiations, or clinical protocol discussions.
Tables 1–3: Reading Guides for Different Audiences
| Reader Type | Core Value of This Article | Recommended Sections to Focus On |
| Clinicians | Identify data signals that will change treatment guidelines | 3.0 (Technical Mainstream), 5.0 (Practical Guidelines) |
| R&D Leaders | Assessing the timing of technological shifts and platform selection | 2.0 (Industry Consensus), 3.0 (Technology Roadmap), 4.0 (Industry Trends) |
| Investors | Transforming technical data into investment decision-making criteria | 2.0, 3.0, 4.0 (All) |
| Head of Business Development, China | Identifying European MRCT opportunities and securing a differentiated position | 4.4 (Opportunities in China and Asia), 5.4 (Recommendations for Attending the Asia Conference) |
| Regulatory Affairs Specialist | Keep up to date with the EMA’s latest position on gene editing safety | 2.3 (Regulatory Signals), 3.2 (Regulation of Base/Prime Editing) |
Structurally, this article is divided into six main sections, forming a complete cycle that progresses logically from the macro-level context to a deep dive into the technology, industry trends, practical guidelines, and a concluding summary. You can read it sequentially to get the full picture, or skip to specific sections as needed based on the table above.
Finally, a note on prerequisites: The technical language of hematological CGT is relatively specialized. This article assumes readers have a basic background in tumor immunology and are familiar with fundamental concepts such as CAR-T, AAV, and CRISPR. For readers without a specialized background, we will provide brief annotations when key technical terms are used, but we will not deliberately simplify the depth of the technical discussion—because that depth is precisely the reason this article exists.
2.0 bio 2026 Perspective: Global CGT in the First Half of 2026 — Reconstructing Consensus from Wealth Myths to a Commercial Ice Age
2.1 Systemic Bottlenecks in Ex Vivo CAR-T
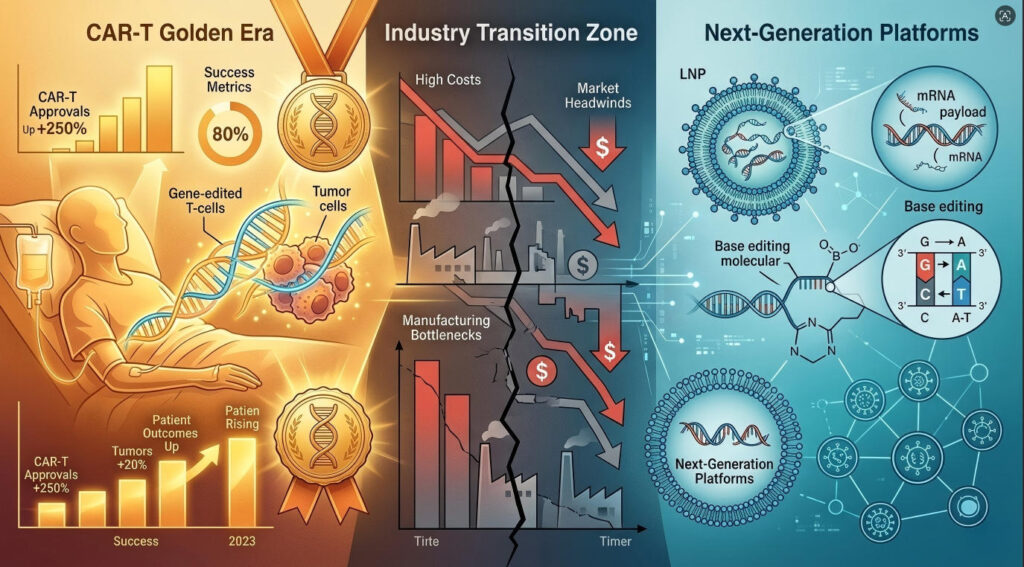
To understand why the global CGT industry is undergoing a collective shift in 2026, we must first recognize that ex vivo autologous CAR-T technology itself has not failed; its clinical efficacy has been thoroughly validated in hematological malignancies such as multiple myeloma, B-cell lymphoma, and ALL.. With BIO International Convention as a key industry backdrop, What has truly failed is the industry assumption that excellent clinical data automatically translates into commercial success.
2.1.1 Million-Dollar Pricing, Capacity Constraints, Excessively Long Vein-to-Vein Time, and the Inscalability of Personalized Manufacturing
The commercialization challenges facing autologous CAR-T stem from a structural paradox: its efficacy relies on the personalized collection, modification, and reinfusion of T cells for each patient. This process is highly personalized from a biological perspective but highly unscalable from a business model perspective.Each production batch serves only one patient, with a production cycle typically requiring 3–6 weeks (vein-to-vein time). The costs associated with quality control, cold chain logistics, and transportation for each batch are extremely high, making it difficult for the final product cost to fall below $500,000. When this cost is compounded by pharmaceutical companies’ profit margins, hospital procurement markups, and patients’ limited ability to pay, the final price inevitably falls within the range of $1.2 million to $4.5 million.
However, the truly fatal issue is not the high price, but the breakdown in the payment chain. In the United States, private insurance companies have begun systematically rejecting or delaying approval of CAR-T treatments; in Europe, Health Technology Assessment (HTA) agencies in multiple countries have negotiated actual reimbursement rates for CAR-T products down to 30–50% of the listed price, or have even outright refused to include them in national health insurance coverage. In this environment, even with perfect clinical data, achieving significant sales volume is virtually impossible.
Table 2-1: Six Major Systemic Bottlenecks in the Commercialization of Autologous CAR-T
| Bottleneck Dimension | Specific Manifestations | Quantified Impact |
| Pricing | End-user price of autologous CAR-T: $1.2–4.5 million per patient | Estimated global patient population with actual affordability is less than 5% of the total patient population |
| Production Capacity | Each batch serves only one patient, resulting in a low ceiling for factory utilization | Actual utilization rate at Novartis’ Kymriah facility has long been below 50% |
| Vein-to-Vein Time | Typically 3–6 weeks; critically ill patients face the risk of disease progression during the waiting period | Approximately 15–20% of patients experience disease progression during the waiting period and cannot be re-infused |
| Quality control failure rate | 5–15% of personalized production batches fail quality control | resulting in longer wait times for patients or the complete loss of treatment opportunities |
| Reimbursement | Reimbursement rates in major European and U.S. markets are less than 50% | 2seventy bio’s 2021 sales were significantly below analyst expectations |
| Intensifying competition | Bispecific antibodies (such as Teclistamab) are capturing a portion of the market at lower costs | Expansion of CAR-T’s first-line indication for MM faces obstacles |
The issue of excessively long vein-to-vein time warrants a separate discussion. A patient with advanced multiple myeloma, after being deemed eligible for CAR-T therapy, typically must first undergo leukapheresis (leukocyte separation), wait 3–6 weeks for product manufacturing, and then undergo lymphodepleting chemotherapy before the final infusion.During this 6–8-week cycle, patients often require bridging chemotherapy to control disease progression; however, this chemotherapy itself impairs T-cell function, which in turn affects the final product quality, creating a vicious cycle.
By 2026, this issue had begun to be quantified in Full Response’s pivotal trial data: studies showed that patients who experienced a decline in their ECOG score during the waiting period had a complete remission (CR) rate approximately 18–25 percentage points lower after CAR-T reinfusion compared to patients whose condition remained stable at baseline. This is a significant factor in efficacy decline that was previously overshadowed by the brilliance of clinical data but has only been fully recognized during the commercialization phase.
The fundamental issue preventing the scalability of personalized manufacturing lies in the fact that each production batch of autologous CAR-T represents a distinct GMP manufacturing process, requiring independent quality control, independent release testing, and independent cold-chain transportation protocols. This means that regardless of the number of batches produced, the cost per batch cannot be significantly reduced through economies of scale. This logic differs entirely from that of traditional small-molecule drugs or antibody therapies, where a single batch can produce tens of thousands of doses.As long as this fundamental contradiction remains unresolved, the business model for autologous CAR-T will always face a ceiling.
2.2 Three Major Shifts Currently Taking Place in the Industry
Faced with the systemic challenges of autologous CAR-T, the global CGT industry underwent a genuine strategic realignment between 2025 and the first half of 2026. This is not the typical hype surrounding “transformation” often seen in media reports, but rather a structural shift that can be simultaneously verified by three independent indicators: funding data, pipeline distribution, and talent mobility.
2.2.1 From In Vitro Personalization to Direct In Vivo Reprogramming
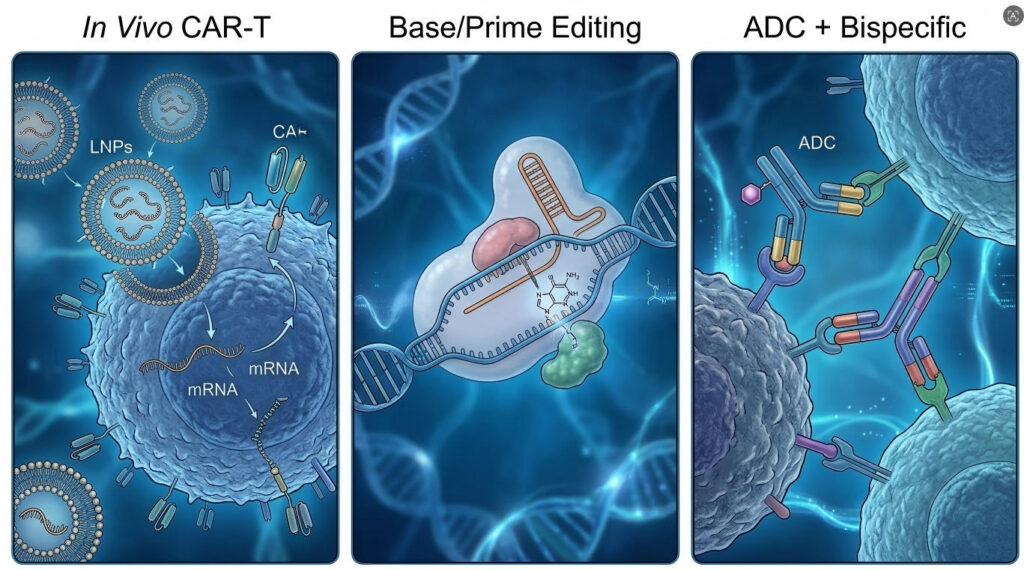
The core logic of In Vivo CAR-T is this: since the primary cost of autologous CAR-T stems from ex vivo T-cell cultivation, could we bypass this step and directly convert T-cells into CAR-T cells within the patient’s body? By using an LNP (lipid nanoparticle) delivery system—similar to that of mRNA vaccines—to carry CAR constructs and target T-cells in vivo, we can achieve in situ reprogramming.
This concept has already progressed from theoretical feasibility to the early clinical validation stage. Research teams at the University of Pennsylvania and the Dana-Farber Cancer Institute have demonstrated in animal models that an LNP system targeting CD3ε can efficiently transfect T cells in vivo, induce CAR expression, and achieve tumor control comparable to autologous CAR-T in mouse models of hematologic malignancies.In 2026, the early human (FIH) portion of these data is expected to be presented for the first time at the EHA.
Looking at funding data, from 2025 to early 2026, the total funding raised by companies related to In Vivo CAR-T exceeded $1.5 billion, with Capstan Biosciences completing a $150 million Series A round and Engenes completing a $200 million Series A round. The signal from the capital markets is clear: In Vivo is not science fiction confined to the laboratory, but rather a direction on which the industry is betting real money.
2.2.2 From First-Generation Gene Editing (CRISPR DSB) to the Era of Safety with Base/Prime Editing
The double-strand break (DSB) mechanism of CRISPR-Cas9 sparked a gene-editing revolution, but it also brought significant safety concerns that cannot be ignored: DSBs can trigger chromosomal rearrangements, large-scale deletions, and potential risks of clonal hematopoiesis. In patients with hematologic malignancies (who already face a higher risk of secondary tumors), these safety issues have been prioritized for review by regulatory authorities and clinical researchers.
The accumulation of long-term follow-up (LTFU) data from 2025 to 2026 has transformed these concerns from theoretical considerations into real-world pressures. Multiple products utilizing first-generation CRISPR-Cas9 have detected signals of clonal hematopoiesis during three-year follow-up; although these have not yet progressed to malignancies, they are sufficient to trigger safety reviews by the FDA and EMA. This has prompted the industry to seriously evaluate editing tools that do not rely on DSBs—namely, Base Editing and Prime Editing.
Base Editing achieves direct conversion of target bases without creating DSBs by modifying the Cas9 protein into a cleavage-only version (which cuts only single strands) and combining it with a deaminase. Prime Editing, meanwhile, enables arbitrary base substitutions and small-fragment insertions/deletions through a search-and-replace mechanism, also without relying on DSBs. The theoretical advantages of these two technologies regarding genomic stability are increasingly supported by preclinical and early clinical data.
2.2.3 From Single Technologies to Convergent Innovation: Delivery Platforms Combined with Combination Therapy
One of the most noteworthy industry trends in 2026 is that an increasing number of top-tier research institutions are beginning to view delivery platforms—rather than gene editing tools—as their core competitive advantage. With a delivery platform capable of precisely targeting specific cell types (T cells, hematopoietic stem cells, NK cells), one can flexibly load different therapeutic payloads—today a CAR construct, tomorrow a gene editing tool, and the day after tomorrow a small-molecule regulatory factor.
Another dimension of convergent innovation is combination therapy. The limitations of single-technology approaches are being repeatedly demonstrated: the duration of remission with single-agent CAR-T is constrained by T-cell exhaustion and antigen loss;monotherapy with ADCs faces bottlenecks in drug resistance and toxicity management; and small-molecule inhibitors require constant iteration in the face of resistance mutations. Combining technologies with different mechanisms—sequential ADC plus CAR-T, LNP delivery plus gene editing, and nucleic acid therapeutics plus small-molecule modulators—to create asymmetric complementarity is becoming the core strategy for breaking through the limitations of monotherapy.
Table 2-2: Comparison of the Three Major Shifts in the CGT Industry by 2026
| Shift Direction | Core Drivers | Representative Institutions/Technologies | Expected Highlights at EHA 2026 |
| Ex Vivo to In Vivo | Manufacturing Cost Crisis, Accessibility Needs | University of Pennsylvania, Dana-Farber, Capstan Bio | First-in-Human (FIH) Data, LNP Delivery Efficiency |
| DSB CRISPR to Base/Prime Editing | Regulatory Safety Pressures, LFTU Requirements | Beam Therapeutics, Prime Medicine | 3–5-year LTFU data, clonal hematopoietic signals |
| From Single Technology to Delivery Platforms + Combination Therapies | Platform-based competitive logic, monotherapy ceiling | Precision BioSciences, Iovance Biotherapeutics | Platform adaptability data, multi-payload combinations |
2.3 New Regulatory Signals: Interpretation of the Latest Guidance from the FDA and EMA in the First Half of 2026 on Long-Term Safety of Gene Editing and LNP Delivery
Regulatory changes are among the most significant external variables for the CGT industry in 2026. In the first half of 2026, the FDA and EMA issued several key guidance documents related to gene editing and cell therapy almost simultaneously. The signaling value of these documents far exceeds their direct regulatory significance—they represent the regulators’ clear stance on the next phase of technological pathways.
In its March 2026 update to the draft guidance on “Long-Term Follow-Up for Gene Therapy,” the FDA expanded the minimum LTFU requirement from the original 5 years (for high-risk products) to cover all products using integrative vectors or genome editing tools. It explicitly requires systematic monitoring of changes in clonal hematopoiesis (CH) and mandates the submission of at least 3 years of persistence data during the application phase.This change places direct regulatory pressure on first-generation products that are still in the 2-year follow-up period.
In the “Clinical Quality of Advanced Therapy Medicinal Products (ATMPs)” guidance published by the EMA in April 2026, three new evaluation modules—in vivo stability, target cell specificity, and immunogenicity—were specifically added for LNP delivery systems, directly addressing the key technical challenges of in vivo CAR-T therapies. The EMA’s position is that LNP-delivered in vivo therapies must provide more detailed in vivo distribution data and immune activation assessments than traditional viral vectors.
For attendees at EHA 2026, these two regulatory signals have direct practical implications: when you see early-stage data on an in vivo CAR-T or base editing therapy in the poster session, proactively ask the investigators whether they have established a long-term follow-up (LTFU) monitoring plan and whether that plan complies with the latest FDA and EMA requirements. A research team’s response to this question often provides a more accurate prediction of a pipeline’s future regulatory feasibility than the clinical data itself.
Table 2-3: Key CGT Regulatory Documents from the FDA/EMA in the First Half of 2026
| Regulatory Document | Release Date | Key Requirements | Impact on the Industry |
| FDA Draft Update on Gene Therapy LTFU | March 2026 | All integrative/editing products require ≥3 years of LTFU, with systemic monitoring of the hematopoietic system | Creates regulatory pressure for first-generation CRISPR DSB products |
| EMA ATMP Clinical Quality Update Guidance | April 2026 | LNP delivery requires assessment of in vivo distribution, target cell specificity, and immunogenicity | Higher technical thresholds for in vivo CAR-T |
| FDA Draft Guidance on Allogeneic Cell Therapy | February 2026 | Clarifies Conditions for HLA Compatibility Exemptions for Off-the-Shelf Products | Opening a Regulatory Window for the Large-Scale Adoption of Allogeneic CAR-T |
It is particularly noteworthy that in the draft guidance on “Allogeneic Cell Therapy” issued by the FDA in February 2026, the agency clarified that off-the-shelf products may apply for an exemption from HLA compatibility requirements under specific conditions.This is a very important regulatory signal—one of the biggest regulatory hurdles for allogeneic CAR-T is the risk of GvHD caused by HLA incompatibility. The new draft clarifies that this requirement can be relaxed in specific clinical scenarios (such as patients with a short expected survival period or bridge therapy), effectively paving a faster path to commercialization for allogeneic off-the-shelf products.
3.0 From bio 2026 to EHA 2026: Three Core Technology Tracks (The Most Cutting-Edge Content)
3.1 Main Theme 1: In Vivo CAR-T and LNP Delivery—The Quest for the Holy Grail
While at the 2024 EHA conference, only a handful of researchers were quietly discussing the potential of in vivo CAR-T in the poster sessions, by 2026, this topic had taken center stage in oral presentations and plenary sessions. The number of abstracts related to in vivo cell therapy increased by approximately 40% year-over-year, with three selected as Late-Breaking Abstracts—setting a new record for this subfield.
3.1.1 The Dead End of the Traditional Ex Vivo Model vs. the Fundamental Breakthrough of In Vivo
The previous chapter provided a detailed analysis of the systemic bottlenecks in ex vivo autologous CAR-T therapy. Here, we will place ex vivo and in vivo approaches within the same analytical framework for a direct comparison, allowing you to clearly see why the industry so urgently needs in vivo solutions.
The core contradiction of the Ex Vivo model can be summarized by a simple equation: personalized manufacturing = inability to scale = high cost = low accessibility. For every additional patient, a separate GMP manufacturing batch is required—a process that takes 3–6 weeks, costs over $500,000, and carries a failure rate of 5–15%. Under this equation, no matter how promising the clinical data may be, the commercial ceiling remains rigid.
The fundamental breakthrough of the In Vivo model lies in the fact that it fundamentally deconstructs this equation. If LNPs can be synthesized at scale in vitro, just like mRNA vaccines, and if the injection process can be completed in an outpatient setting, much like a routine vaccination, then the manufacturing process shifts from personalized to standardized. It transitions from serving one person per batch to serving thousands per batch, with costs potentially dropping from $500,000 to under $50,000.This is not an incremental improvement, but a paradigm shift in business logic.
Table 3-1: Comparison of Core Dimensions Between Ex Vivo and In Vivo CAR-T
| Dimension | Ex Vivo (Autologous CAR-T) | In Vivo (In-Body Reprogrammed CAR-T) |
| Manufacturing Model | Personalized GMP, 1 patient per batch | Standardized production, thousands of doses per batch |
| Production Cycle | 3–6 weeks (vein-to-vein) | Estimated at a few hours (from injection to onset of effect) |
| Manufacturing cost | $500,000+ per patient | Target: Under $50,000 per patient |
| Administration method | Centralized infusion, requiring lymph node dissection | Outpatient injection, lymph node dissection may not be required |
| Quality control failure rate | 5–15% per batch | High batch-to-batch consistency (similar to vaccines) |
| Patient accessibility | Limited to large medical centers | Can be scaled to community hospitals |
| Key risks | Disease progression during the waiting period | In vivo transduction efficiency, CRS control, hepatotoxicity |
| Commercialization ceiling | Rigid constraints (triple constraints of pricing, production capacity, and reimbursement) | Theoretically surmountable (depending on clinical validation) |
Of course, the in vivo model is still in the early stages of clinical validation and faces significant uncertainties. However, the industry’s collective bet is clear: in vivo is not merely a nice-to-have addition to ex vivo, but the cornerstone of the next-generation CAR-T business model. If the FIH data presented at EHA 2026 demonstrate safety and preliminary feasibility, the window of opportunity for ex vivo approaches will rapidly narrow.
3.1.2 Key Focus Areas: In Vivo T-Cell Reprogramming via mRNA-LNP, Non-Viral Delivery, Bone Marrow/Immune Cell-Specific Targeting, and Transient vs. Persistent Expression
The technical pathways for in vivo CAR-T are not limited to a single approach. Currently, the industry is focusing on four key directions, each with distinct technical challenges and commercialization logic.
Direction 1: In vivo T-cell reprogramming via mRNA-LNP. This is currently the most mainstream approach and the source of the most closely watched data at EHA 2026.The core concept involves encapsulating mRNA encoding CAR within LNPs and directing the LNPs to T cells in vivo via ligand modification targeting CD3 or CD7, thereby achieving in situ CAR expression. The Weissman/Bhatt team at the University of Pennsylvania and Capstan Bio are leading representatives of this approach.
Approach 2: Non-viral delivery. In addition to LNPs, non-viral delivery vectors such as polymeric nanoparticles and extracellular vesicles (exosomes) are also being explored.A polymeric nanoparticle system currently under development at the Dana-Farber Cancer Institute has reportedly demonstrated superior T-cell targeting compared to certain LNP formulations. Common advantages of non-viral delivery include lower immunogenicity than viral vectors and the ability to administer repeated doses; however, the preparation process is more complex, and scaling up presents greater challenges.
Direction 3: Bone Marrow/Immune Cell-Specific Targeting. Currently, most in vivo approaches focus on the targeted transfection of peripheral blood T cells, but a more ambitious goal is to directly target hematopoietic stem cells (HSCs) or immune progenitor cells in the bone marrow.If in vivo gene editing or CAR insertion can be achieved at the HSC level, a single treatment could generate a persistent, self-renewing population of CAR-T cells, fundamentally resolving the issue of durability. This approach is currently in the animal model phase; EHA 2026 is not expected to yield significant human data, but it warrants long-term monitoring.
Direction 4: Transient Expression vs. Persistent Expression. The inherent characteristic of the mRNA-LNP system is transient expression—CARs typically persist on the T-cell surface for only 2–4 weeks. While this is an advantage in certain clinical scenarios (controllable safety, low risk of CRS), it may be a disadvantage in settings requiring long-term immune surveillance.Current solutions include: repeated dosing regimens (similar to vaccine boosters), the use of integrative vectors (such as the Sleeping Beauty transposon system) to achieve sustained expression, or the design of self-amplifying RNA (saRNA) to extend the expression duration. Data from EHA 2026 will provide the first direct evidence of whether transient expression is sufficient to generate clinical efficacy in humans.
Table 3-2: Comparison of Four Key Focus Areas for In Vivo CAR-T
| Area | Technical Approach | Representative Institutions | Advantages | Challenges | Maturity by 2026 |
| mRNA-LNP T-cell Reprogramming | CD3/CD7-Targeted LNP Delivery of CAR mRNA | University of Pennsylvania, Capstan Bio | Most mature approach; scalable production | Transient expression; requires repeated dosing | First-in-Human (FIH) phase |
| Non-viral delivery | Polymer nanoparticles, exosomes | Dana-Farber, Evox | Low immunogenicity, repeat dosing possible | Complex preparation, difficult to scale up | Preclinical/Early-stage FIH |
| Targets bone marrow/immune cells | Targets HSCs or immune progenitor cells | Multiple academic teams | Single-dose, long-lasting treatment | Extremely low targeting efficiency, high risk of off-target effects | Animal model stage |
| Transient vs. sustained expression | saRNA/integrated vectors enable sustained expression | Umoja Biopharma | Balancing safety and persistence | Safety of integrated vectors remains to be validated | Preclinical Stage |
3.1.3 EHA Highlights: Latest clinical/translational data from institutions including the University of Pennsylvania and Dana-Farber; manufacturability, affordability, and control of CRS/neurotoxicity
According to the abstract preview for EHA 2026, a research team from the University of Pennsylvania will present preliminary safety data from their in vivo CAR-T first-in-human (FIH) study at the conference. This will be among the first publicly available data globally to validate the safety and feasibility of LNP-mediated in vivo T-cell reprogramming in humans, and is expected to be one of the most highly anticipated abstracts at the conference.
Based on the information revealed in the abstract title, the study uses a CD19-targeted CAR construct, with the target indication being relapsed/refractory B-cell acute lymphoblastic leukemia (R/R B-ALL), and all subjects are adult patients who have previously received ≥2 lines of treatment.The primary endpoints are safety (DLT, CRS grading, ICANS grading), while exploratory endpoints include the in vivo dynamics of CAR-T cells, methods for detecting in vivo transfection efficiency, and expansion kinetics.
Several technical issues warrant attention: First, how is in vivo transfection efficiency measured? Second, what is the persistence of CAR-T cells in vivo—mRNA-LNP-mediated transient expression may only last 2–4 weeks; is this sufficient to generate an antitumor effect? Third, do the risks of CRS and neurotoxicity differ from those of autologous CAR-T therapy? Theoretically, since the number of transfected cells in vivo is controllable, the risk of CRS should be lower than that of autologous CAR-T therapy involving massive reinfusion; however, this requires validation through data.
Dana-Farber is expected to report data on T-cell-targeted delivery using polymeric nanoparticles (rather than traditional lipid-based LNPs). A comparison of these two sets of data will provide the industry with first-hand comparative data on different platform technologies.
Manufacturability is a natural advantage of the in vivo approach, but it must be validated under real GMP conditions. While the large-scale production of LNPs has a successful precedent in COVID-19 vaccines, issues such as the scale-up of T-cell-targeting LNP formulation, lot-to-lot consistency of ligand modifications, and the stability of the final product all require answers from EHA data.
Affordability is the core commercial promise of the in vivo approach. If manufacturing costs drop from $500,000 to under $50,000, the corresponding price range is projected to be $200,000–$500,000, placing the product within the scope of health insurance negotiations in most Western countries. This could expand the actual patient population with access to the treatment by 5–10 times the current level. However, this requires verification of manufacturing costs under actual GMP conditions, not theoretical calculations on a PowerPoint slide.
CRS/neurotoxicity control is the most critical issue in terms of safety. In vivo, it is theoretically possible to control the number of CAR-T cells in the body by adjusting the LNP dose, thereby reducing the risk of CRS. However, this also implies that multiple doses may be required to achieve sufficient antitumor efficacy. Will repeated dosing increase immunogenicity and hepatotoxicity? Safety data from EHA 2026 will provide firsthand evidence from human trials.
3.1.4 Commercial Implications: Whoever can truly solve the challenges of large-scale production and accessibility for the general patient population will win the next round of financing and business development
If the clinical feasibility of In Vivo CAR-T is preliminarily demonstrated at EHA 2026, what does this mean for the commercial landscape of the entire CGT industry? The answer to this question warrants deeper consideration than the efficacy data itself.
First, manufacturing barriers will no longer be a core competitive advantage. Currently, the competitive moats of major pharmaceutical companies like Novartis, BMS, and Gilead in the CAR-T field are largely built on their GMP production capabilities and manufacturing experience.Once In Vivo CAR-T is clinically viable, this barrier will be significantly weakened—because the large-scale production of LNPs is already a mature process, and the cost of mRNA synthesis has dropped to single-digit dollars per milligram following the mass production of COVID-19 vaccines. New competitive barriers will shift to: targeted delivery specificity, CAR construct design, and intellectual property strategy.
Second, the focus of the next round of financing will undergo a fundamental shift. For CGT financing prior to 2024, the core narrative was clinical data driving valuation; for financing after 2026, the core narrative will shift to delivery platform capabilities combined with accessibility solutions.A company possessing an efficient T-cell-targeting LNP platform may command a significantly higher valuation premium in Series A/B funding rounds than a company with only an ex vivo CAR-T pipeline. This implies that if you are the CEO of an ex vivo CAR-T company, 2026 represents the final window of opportunity to seriously evaluate a strategic pivot in your technology path.
Third, the structure of business development (BD) deals will also change. Traditional CGT BD deals involve pipeline licensing (licensing out a specific indication), but in the In Vivo era, BD deals will increasingly involve platform licensing—licensing not a single CAR-T product, but a delivery platform capable of carrying multiple therapeutic payloads. The valuation models for platform licensing and pipeline licensing are entirely different: the former is priced based on the platform’s applicability and scalability, while the latter is priced based on the commercial potential of a single indication.For Chinese biotech companies, if you possess a delivery platform with a differentiated advantage, your bargaining power in BD negotiations will be significantly higher than that of companies with only a single pipeline.
For Chinese biotech companies, the business logic of In Vivo also holds a unique local advantage: if future CAR-T competition shifts to delivery platforms and molecular design, the capabilities Chinese companies have built in CRO services—including in vitro pharmacodynamic studies, LNP formulation optimization, and in vivo model evaluation—will provide the foundation for domestic biotech firms to rapidly establish a presence in this new arena.
3.2 Main Theme 2: Base Editing and Prime Editing—A New Regulatory Game in Europe Driven by Safety
If In Vivo CAR-T represents the commercial revolution narrative at EHA 2026, then Base Editing and Prime Editing represent the safety revolution narrative. The reason both have become focal points at top-tier conferences in 2026 stems from a single driving force: the accumulation of LTFU data is prompting regulators and the industry to re-examine the long-term risks of gene editing, and the outcomes of this re-examination are having distinctly different impacts on first- and second-generation technologies.
3.2.1 The Technical Logic and Advantages of Moving Beyond Double-Strand Breaks (DSBs)
To understand the value of Base Editing and Prime Editing, one must first understand the problems they aim to solve.CRISPR-Cas9 (the first-generation gene editing tool) achieves gene knockout or correction by creating double-strand breaks (DSBs) at the target DNA site and then utilizing the cell’s DNA repair mechanisms (NHEJ or HDR). While this mechanism is highly effective, the DSB itself constitutes a form of DNA damage that triggers the cell’s damage response, potentially leading to the following outcomes with a certain probability:
① Chromosomal translocation: Especially when multiple sites are cut simultaneously, different chromosomal segments may reconnect;
② Large deletions: During DSB repair, large segments of DNA surrounding the cleavage site may be deleted;
③ Abnormal chromosome segregation: Severe DSBs may disrupt the normal progression of mitosis;
④ Clonal selection pressure: Cells carrying specific genomic alterations gain a competitive advantage during mitosis, leading to clonal expansion with potential tumorigenic risk.
Base editing achieves the direct conversion of C to T (or A to G) at the target site without generating DSBs by functionally modifying the Cas9 protein (into a single-strand cleaving version) and combining it with a deaminase.The entire process does not require DNA breaks and, in theory, does not pose the aforementioned risks of genomic instability associated with DSBs. Prime editing is even more flexible; through a search-and-replace mechanism, it can achieve any type of base substitution, small-scale insertions, and small-scale deletions, also without relying on DSBs.
Table 3-3: Comparison of Key Parameters for Third-Generation Gene Editing Tools
| Technology Comparison | CRISPR-Cas9 (First Generation) | Base Editing | Prime Editing |
| Breakage Mechanism | Double-strand break (DSB) | Single-strand nick (Nick, does not produce a DSB) | Single-strand nick (does not result in a DSB) |
| Supported Editing Types | Insertions, Deletions (NHEJ); Homologous Recombination (HDR) | C→T or A→G single-base conversion | Any base substitution, small fragment insertion/deletion |
| Off-target risk types | Chromosomal rearrangements, large-fragment deletions, clonal selection | Non-specific deaminase activity, RNA off-target effects | Non-specific editing caused by pegRNA design errors |
| Genomic stability | Low (DSBs trigger stress responses) | High (no DSBs) | Higher (no DSBs) |
| Cytotoxicity | Higher (DSBs trigger DNA damage stress) | Low | Moderate (reverse transcriptase activity exhibits some toxicity) |
| Therapeutic stage | Multiple products are already on the market | Some have entered Phase II | Phase I/II, earlier stages |
3.2.2 EHA Key Focus Areas: Long-term follow-up data (3–5 years), off-target rates, clonal hematopoiesis, risk of secondary tumors, and hematopoietic stem cell persistence
EHA 2026 is the world’s largest platform for aggregating hematology data and one of the annual conferences with the most publicly presented LTFU data to date. Early-stage data from Beam Therapeutics’ BEAM-101 (a base-editing therapy for sickle cell disease) and companies such as Prime Medicine will undergo their first systematic review by leading global hematologists at this conference.
Regarding these LTFU data, the following five dimensions warrant particular attention:
① Long-term follow-up data (3–5 years): This is key to determining whether editing efficiency is sustainable. The long-term maintenance of HbF (fetal hemoglobin) levels is a core efficacy indicator for sickle cell disease therapies; ideally, HbF levels should remain above 25% three years post-treatment.
② Dynamic changes in off-target rates: Simply reporting baseline off-target rates is insufficient; more importantly, it is necessary to determine whether mutations at off-target sites exhibit a trend of clonal expansion during follow-up.
③ Clonal hematopoietic signals: Hematopoietic stem cell editing products require long-term blood cell sequencing post-transplant to monitor for the competitive proliferation of hematopoietic stem cell clones carrying specific mutations.
④ Risk of secondary tumors: This is the most serious safety concern associated with gene editing therapies. Although there have been no reports of secondary malignancies in patients treated with Base/Prime Editing products to date, the duration of follow-up is still insufficient to rule out this risk.The presence of any abnormal clonal expansion or hematopoietic abnormalities in 3–5 years of follow-up data will serve as key indicators for assessing the risk of secondary tumors. Any confirmed case of a secondary malignancy could lead to a drastic tightening of regulatory pathways.
⑤ Persistence of Hematopoietic Stem Cells: The ability of edited hematopoietic stem cells (HSCs) to maintain their self-renewal capacity in vivo over the long term determines the durability of therapeutic efficacy. If edited HSCs lose their self-renewal capacity within 1–2 years, patients may require a second transplant, which poses a fundamental challenge to the business model.
Table 3-4: Evaluation Framework for Base/Prime Editing LTFU Data
| LTFU Data Dimensions | Desired Signals (Smooth Regulatory Pathway) | Warning Signals (Increased Regulatory Pressure) | Warning Signals (Significant Regulatory Resistance) |
| HbF Persistence | ≥25% at 3 years | 15–25% at 3 years | <15% at 3 years or continuing to decline |
| Clonal hematopoiesis detection rate | <2% at 24 months | 2–5% at 24 months | Greater than 5% at 24 months |
| Trend in clonal expansion | No expansion or mildly stable | Mild expansion but no acceleration observed | Sustained accelerated expansion |
| Off-target mutation dynamics | Off-target frequency is stable or decreasing | Off-target frequency fluctuates slightly | Off-target frequency continues to rise |
| Secondary malignancies | None | None (but requires ongoing monitoring) | Any confirmed cases |
| Persistent HSC | HSC maintenance for ≥3 years post-edit | Decline in edited HSCs within 1–3 years | Significant decline in post-editing HSC within 1 year |
3.2.3 Regulation and Practical Application: How to Assess a Gene-Editing Company’s Risk of Delisting or Potential for Global Expansion Through Oral Presentations and Posters
This is one of the most practical yet least-discussed skills among EHA attendees: how to assess a gene editing company’s true commercial prospects using publicly available conference data. Below is a proven framework for interpreting data that helps you extract commercial signals from oral presentations and posters that go beyond the abstracts.
Five-Dimensional Signals for Assessing Delisting Risk:
① LTFU Follow-Up Completeness: If a company’s oral presentation only presents data from a minimum 6-month follow-up, while its earliest enrolled patients have already exceeded 24 months, what does this imply? It likely indicates selective presentation of favorable data points, and long-term data may be problematic.
② Level of Disclosure on Clonal Hematopoiesis: Companies that proactively disclose clonal hematopoiesis detection rates and provide individual patient data—even if the data is imperfect—are more trustworthy than those that only report medians and avoid specifics. Transparency itself is a safety signal.
③ Upgrades to off-target detection methodologies: If a team reports off-target rates using low-sensitivity methods in 2024 and has still not upgraded its detection methods by 2026, this is a clear warning sign—not because they necessarily have a problem, but because their data is insufficient to prove they do not.
④ Signs of pipeline contraction: If a company has scaled back from 3–4 indications two years ago to just 1–2, without providing a compelling strategic rationale for this focus, this is often a retrospective signal that pipeline advancement is facing difficulties.
⑤ Cash Burn Rate: Although this is not conference data, by combining the company’s recent funding rounds with its cash runway statements, one can estimate how much time they have left. For a gene editing company with a cash runway of less than 18 months, the risk of delisting increases significantly, regardless of how good its EHA data may be.
Four-Dimensional Signals for Assessing Global Expansion Potential:
① Depth of EMA Engagement: If researchers can clearly describe the Scientific Advice process and feedback from the EMA, it indicates they are already preparing for a European submission. Those who merely state that the regulatory path is clear but cannot provide details likely have a global expansion strategy that remains largely on paper.
② Multi-Center Trial (MCT) Strategy: Base/Prime Editing products that have already begun or plan to conduct multi-center trials in China or Asia demonstrate significantly greater potential for global expansion than those advancing in only a single region, such as the U.S. or Europe. MCT data can simultaneously meet the requirements of multiple regulatory systems.
③ Global Epidemiological Differences in Indications: If the product targets an indication with a higher prevalence or unique molecular characteristics in Asian populations (such as hemoglobin E disease, which is common in Southeast Asia), this difference itself constitutes a competitive advantage for global expansion.
④ Manufacturing Transferability: Can the GMP manufacturing of gene editing products be transferred across technical platforms in different regions? If the manufacturing process is highly dependent on a specific supplier or non-replicable process conditions, the manufacturing challenges associated with global expansion will be amplified.
Table 3-5: Conference Data Framework for Assessing Gene-Editing Companies’ Delisting Risks and Global Expansion Potential
| Assessment Dimensions | High Delisting Risk Signals | Signals of High Overseas Expansion Potential |
| Completeness of LTFU | Selective presentation of short-term follow-up data; avoidance of long-term follow-up | Proactively disclose complete follow-up data and provide individual patient data |
| Safety Transparency | Report only medians; avoid details | Proactively share updates to testing methodologies and results |
| Regulatory Interactions | Vague language; no specific details on EMA/FDA communications | Records of Scientific Advice available; regulatory pathway can be described |
| Pipeline Updates | Indications continue to narrow; no reasonable explanation provided | Clear focus on indications, with plans for new indication expansion |
| Manufacturing Transferability | Highly dependent on a single supplier/process | Standardized manufacturing processes, transferable across regions |
3.2.4 Unique Opportunities Arising from Regulatory Differences Between Europe and the U.S.
Differences in CGT regulatory strategies between the EMA and FDA have long been overlooked, but as we approach the 2026 timeline, these differences are creating tangible commercial opportunities.
The EMA’s regulatory philosophy leans toward conditional approval coupled with post-marketing data supplementation: when early clinical data for a product demonstrate a significant benefit-risk ratio, the EMA can grant Conditional Marketing Authorization (CMA) to allow the product to enter the market early, requiring the applicant to complete specific follow-up studies after market launch.This model is particularly advantageous for Base/Prime Editing products—since long-term follow-up (LTFU) data for such products inherently requires time to accumulate, the EMA’s CMA mechanism allows patients to benefit before the LTFU data is complete.
The FDA, by contrast, places greater emphasis on comprehensive pre-marketing data. This difference implies that a base-editing product could be approved first in Europe, using European real-world data to supplement the long-term follow-up (LTFU) data required by the FDA, thereby enabling a market launch strategy where Europe leads and the U.S. follows. For Chinese biotech companies, this logic applies equally: if they can initiate multi-center real-world clinical trials (MRCTs) in Europe first and accumulate real-world data recognized by the EMA, subsequent Biologics License Application (BLA) submissions to the FDA will have additional data support.
3.3 Main Theme Three: Asymmetric Combination Strategies for ADCs, Bispecific Antibodies, Small Molecules, and Nucleic Acid Drugs
The third technical focus area at EHA 2026 differs fundamentally from the first two: it is not a breakthrough in a single technology, but rather a systematic innovation in the combined application of multiple seemingly mature technologies.ADCs, bispecific antibodies, small-molecule kinase inhibitors, and nucleic acid therapeutics—all four of these technologies already have marketed products and have accumulated extensive clinical experience in the field of hematological malignancies. However, the core question for 2026 is: how can they be combined to break through the limitations of monotherapy?
3.3.1 Target Reshuffling and Next-Generation Optimization of ADCs/Bispecific Antibodies in Hematological Oncology (Linkers, Payloads, Low-Toxicity Platforms)
Over the past two years, the field of ADCs for hematological malignancies has undergone a profound reshuffling of targets. First-generation ADCs for hematological malignancies (represented by CD33-ADCs) have gradually faded from the scene due to poor selectivity and excessive toxicity;Second-generation products, represented by BCMA-ADCs (Belantamab mafodotin), have demonstrated the value of the target in multiple myeloma, but their commercialization path has been rocky due to ocular toxicity. The third-generation ADCs showcased at EHA 2026 have been optimized primarily in three dimensions:
① Target selection: A shift away from BCMA—a target already heavily occupied by CAR-T and bispecific antibodies—toward multiple differentiated targets such as GPRC5D, FcRH5 (FCRL5), and CD38. GPRC5D is highly expressed on multiple myeloma cells and very low in normal tissues, making it one of the currently recognized optimal ADC targets for hematologic malignancies.
② Linker/Payload Optimization: A shift from early-generation microtubule-associated protein inhibitors (MMAE/MMAF) to topoisomerase I inhibitors (such as DXd and SN-38). The bystander effect of the latter in hematologic malignancies is more advantageous for treating tumors with target heterogeneity.
③ Toxicity Management: To address ocular toxicity, new-generation products have significantly reduced the incidence of Grade 3–4 ocular adverse events by modifying the physicochemical properties of ADCs (reducing cationicity and lowering affinity for the corneal epithelium) or adjusting dosing regimens.
Table 3-6: Key Technical Advancements in ADCs/Bispecific Antibodies for Hematologic Malignancies by 2026
| Technology Type | Targets (Examples) | Key Advances in 2026 | Improvements Over First-Generation Products |
| ADC | GPRC5D, FcRH5, CD38 | DXd payload replaces MMAE; new toxicity management strategies | Reduced ocular toxicity, enhanced bystander effect, optimized DA ratio |
| Bispecific Antibodies | CD3×BCMA, CD3×GPRC5D | Cross-target strategy following BCMA resistance | Avoiding indications that directly compete with CAR-T |
| Trivalent antibodies | CD19×CD22×CD3 | Targeting relapse due to antigen loss | Addressing the Core Limitations of Monotargeted Bispecific Antibodies |
3.3.2 Resilience and Breakthroughs in Drug Resistance for Small-Molecule Kinase Inhibitors (BTK, FLT3, BCL-2, etc.)
Unlike the disruptive innovation narrative surrounding CGT, the 2026 story in the small-molecule kinase inhibitor field is one of resilience and breakthroughs in overcoming drug resistance.BTKis (BTK inhibitors), FLT3is (FLT3 inhibitors), and BCL-2is (BCL-2 inhibitors) are the three core small-molecule targets in hematologic oncology. Related products (ibutitinib, venetoclax, etc.) have become deeply embedded in treatment guidelines, but the issue of drug resistance has become increasingly prominent over time.
Resistance to BTK inhibitors is the most typical example. Resistance to first-generation BTKis (ibutinib) due to the BTK C481S mutation led to the development of second-generation covalent BTKis (acalabrutinib); resistance to second-generation products, in turn, led to the development of non-covalent BTKis (pirtobrutinib).Currently, mechanisms of resistance to non-covalent BTKIs have been reported (primarily BTK T474I/L and V416L mutations). At EHA 2026, early data on at least 2–3 fourth-generation BTKIs designed to address these new resistance mechanisms are expected to be presented. This represents a classic arms race scenario—the success of each generation of drugs simultaneously fosters the emergence of resistance mechanisms in the next generation.
Regarding BCL-2 inhibitors (Venetoclax), resistance mechanisms are more complex, involving multiple parallel pathways such as the BCL-2 G101V mutation, MCL-1 upregulation, and BFL-1 expression.Key highlights for EHA 2026 include: Can the new generation of BCL-2/BCL-XL dual inhibitors re-establish efficacy in patients resistant to venetoclax? And will combination regimens of venetoclax with novel targeted therapies (such as FLT3 inhibitors and IDH1/2 inhibitors) outperform current standard treatments?
3.3.3 Highlights of Cross-Technology Integration: ADC + CAR-T sequencing, LNP as a delivery vehicle, and nucleic acid drugs combined with small molecules to regulate gene editing efficiency
The central theme of combined hematologic oncology therapies in 2026 is identifying asymmetric complementarity between different technological mechanisms: avoiding the accumulation of toxicity while achieving synergistic efficacy. The following three combination models appeared most frequently in the abstracts of EHA 2026:
First: ADC followed by CAR-T sequencing. The rationale is to first reduce tumor burden and disrupt the immunosuppressive microenvironment using the bystander effect of ADCs, followed by CAR-T to elicit a durable immune response.Data presented at EHA 2026 are expected to show that sequential BCMA CAR-T therapy following BCMA-ADC pretreatment yields superior outcomes compared to direct CAR-T therapy, with longer-lasting complete remissions (CR). The key challenge lies in optimizing the timing window—how soon after ADC administration should CAR-T be initiated to fully leverage the ADC’s tumor-reducing effects without compromising CAR-T expansion due to ADC-induced hematological toxicity?
Second: Using LNPs as delivery vehicles to enhance gene editing efficiency. An emerging research direction involves using LNPs to deliver small-molecule PCSK9 inhibitors or EZH2 inhibitors to T cells, thereby improving T-cell metabolic status and resistance to exhaustion, and consequently enhancing CAR-T cell expansion efficiency in vivo. This approach expands the role of LNPs from a simple delivery vehicle to a platform for regulating T-cell status.Concurrently, the use of LNPs to deliver gene-editing tools (such as mRNA and sgRNA for Base Editors) to hematopoietic stem cells (HSCs) is another key technological focus at the 2026 EHA conference. This approach holds promise for addressing the functional decline of HSCs caused by in vitro culture during ex vivo editing.
Third: Combining nucleic acid therapeutics with small molecules to regulate gene editing efficiency. Antisense oligonucleotides (ASOs) can be used to downregulate BCL-2 family proteins (enhancing sensitivity to Venetoclax), or siRNAs can be employed to silence MYC, working in synergy with small-molecule FLT3 inhibitors to combat AML.The complementary nature of nucleic acid therapeutics and small molecules at their respective sites of action (nucleic acids act at the mRNA level, while small molecules act at the protein level) theoretically enables more comprehensive target blockade. Additionally, since the doses of each can be reduced, this approach minimizes the risk of cumulative toxicity from monotherapy.More importantly, the combination of ASOs/siRNAs with gene editing tools is currently being explored—by pre-regulating the chromatin accessibility of target genes using small molecules or nucleic acid therapeutics, the efficiency of subsequent gene editing can be significantly improved, representing a highly promising area of technological convergence.
Table 3-7: Three Major Models of Cross-Technology Combination Therapies for Hematologic Malignancies
| Combination Model | Synergistic Mechanism | Representative Research Directions (EHA 2026) | Key Challenges |
| Sequential ADC plus CAR-T | ADC reduces tumor burden and breaks immune suppression, while CAR-T induces a durable immune response | Sequential BCMA-ADC to BCMA CAR-T Regimen | Optimized timing window ensures CAR-T cells are not affected by ADC toxicity |
| LNP combined with gene editing/metabolic regulation | LNP-mediated delivery of editing tools to HSCs to improve T-cell status | EZH2i delivered to CAR-T cells via LNP | Validation of LNP targeting efficiency and editing efficiency |
| Nucleic acid therapeutics (ASO/siRNA) combined with small molecules/gene editing | Dual-target blockade at the mRNA and protein levels | Synergy of BCL-2 ASO and Venetoclax | Nucleic acid drug stability and integration of administration routes |
4.0 Cross-Industry Convergence at bio 2026 and Beyond: Imagining the Combination Strategies for 2026–2028
4.1 Delivery Platforms Are Becoming New Core Barriers (LNP, Polymers, Extracellular Vesicles, etc.)

If we were to summarize the most significant technological paradigm shift in the 2026 CGT industry in a single sentence, it would be this: the core of competition is shifting from “what therapeutic molecules are available” to “what platform is used to deliver them.” This assessment is not an abstract theoretical observation, but an industry reality supported by extensive funding data and business development (BD) transactions.
Between 2025 and early 2026, in four out of the five largest Series B and later funding rounds in the global CGT sector, the core competitiveness of the funded companies was described as their delivery platforms rather than their therapeutic molecules. Capstan Biosciences (LNP-based T-cell targeting platform) completed a $150 million Series A round in 2025;Engenes (non-viral HSC delivery platform) completed a $200 million Series A round in 2025; ReNAgade Therapeutics (RNA delivery platform) completed a $270 million Series A round in 2025. A common characteristic of these three companies is that they have no marketed products and no complete Phase II clinical data, yet they have attracted significant investment from top-tier VCs based on the technological scarcity of their delivery platforms.
Why is the value of delivery platforms so highly overestimated? The reason lies in their strategic leverage: a universal, efficient delivery platform can accommodate dozens of different therapeutic payloads simultaneously, effectively serving as a pass to enter multiple therapeutic areas at once. Conversely, a company with excellent molecules but no platform has far less bargaining power in business development negotiations than a company with a platform, because platforms can be valued using standardized metrics, whereas the value of molecules remains highly uncertain until clinically validated.
Table 4-1: Comparison of Major Delivery Platform Technologies and Compatible Payloads
| Delivery Platform Type | Core Technical Features | Representative Companies | Compatible Therapeutic Payloads |
| LNP (Lipid Nanoparticles) | Lipid composition optimized for targeting T cells/HSCs | Capstan Bio, a spin-off from the University of Pennsylvania | mRNA-CAR constructs, base-edited mRNA/sgRNA |
| Polymer nanoparticles | Customizable surface modification for enhanced T-cell specificity | Technology licensing company of the Traverso Lab | Prime Editing components (pegRNA plus Prime Editor protein) |
| Extracellular vesicles/exosomes | Naturally derived from cells, low immunogenicity | Evox Therapeutics, Codiak BioSciences | siRNA, miRNA, CRISPR RNP |
| AAV (Adeno-associated virus) | Mature delivery systems, high transfection efficiency | Spark Therapeutics, uniQure | In vitro gene correction (still primarily used in non-hematological applications) |
| Non-viral nanoparticles | Biodegradable polymers such as PBAE | Umoja Biopharma | Persistent delivery of in vivo CAR constructs |
For Chinese biotech strategic teams monitoring EHA 2026, the signals regarding delivery platform barriers hold direct business development (BD) implications: when considering collaborations with European and American institutions, prioritize evaluating whether the counterpart possesses a licensable delivery platform, rather than focusing solely on a specific therapeutic molecule. The value of a platform lies not only in the first indication it supports but also in its capacity to simultaneously host multiple pipelines over the next 3–5 years—this is where the true synergistic value for BD lies.
4.2 Blurring Technological Boundaries: From CAR-T Companies to Programmable Immunoengineering Platform Companies
In 2026, the industry’s definition of CGT companies is undergoing a quiet restructuring. Five years ago, the industry’s classification logic was clear: CAR-T companies, AAV gene therapy companies, TCR-T companies, and CRISPR editing companies each had distinct technological boundaries and indication positioning. Today, however, these boundaries are blurring at a visible pace.
Take Precision BioSciences as an example: the company initially launched with the ARCUS gene-editing platform, then expanded the platform to allogeneic CAR-T (using ARCUS to delete endogenous TCRs), and further extended its delivery system into the field of LNP in vivo transfection.Today, Precision BioSciences can no longer be simply categorized as a CAR-T company or a gene editing company, but rather as a programmable immune engineering platform company—its core competitiveness lies in the versatility of its platform, not in any specific molecule.
This trend toward platform-based approaches has a direct practical implication for attendees: when you speak with researchers from a company at EHA 2026, don’t just ask what their main product is; instead, ask what their platform can and cannot do, and where the key differentiators lie compared to competitors’ platforms.Teams that can clearly answer these questions often possess genuine technological barriers; those with vague responses are often merely using platform rhetoric to package a single-product logic.
4.3 European Real-World Evidence (RWE) and the Advantages of Public Healthcare Systems
The quality of RWE from Europe’s public healthcare systems surpasses that of the U.S. private healthcare system, and by 2026, this advantage is generating commercial significance that extends beyond academic value.
Several European countries (including France, Germany, the Netherlands, and the five Nordic nations) have established national-level CGT patient registries, requiring mandatory long-term follow-up registration for all patients receiving approved cell and gene therapy products.As of 2026, France’s CANSIGENE registry has enrolled data from over 1,200 patients treated with CAR-T therapy, with a median follow-up of 3.2 years. This is currently one of the highest-quality CAR-T real-world datasets globally.
Starting in 2026, these RWE data will take on a new commercial function: supporting value-based pricing (VBP).In late 2025, the Netherlands reached an RWE-based VBP agreement with BMS regarding Breyanzi (lisocabtagene maraleucel): within two years of initial reimbursement, if patients’ actual overall survival (OS) outcomes fall below a predetermined threshold, BMS must refund a portion of the costs; conversely, if outcomes exceed the threshold, BMS may charge additional fees.This marks the first actual implementation of a VBP agreement in the CAR-T field and is of profound significance.
Table 4-2: Comparison of Major European CGT Patient Registries
| Country | CGT Database | Sample Size (as of 2026) | Data Characteristics | Impact on VBP |
| France | CANSIGENE | ≥1,200 CAR-T patients, median follow-up of 3.2 years | Comprehensive coverage of all marketed CAR-T products | Serves as a reference for CEPS price negotiations in France |
| Germany | DRKS (German Clinical Research Registry) | ≥800 ATMP patients | Focus on GvHD and long-term safety | Reference for G-BA added-value assessment |
| Netherlands | HOVON registry | ≥400 patients with hematologic malignancies treated with CGT | Primary data source for VBP protocols (BMS Breyanzi case) | First implemented VBP protocol data foundation |
| Joint initiative across the five Nordic countries | NOPHO/SVELTE Joint Registry | ≥600 patients (multiple indications) | Unified follow-up standards across 5 countries, ensuring the highest data quality | Provides data support for unified pricing negotiations in the Nordic region |
4.4 Differentiation Opportunities for Chinese/Asian Biotechs at EHA: ADC/Bispecific Antibody Cost Control, Manufacturing Platforms, and Global MRCT Entry Points
For Chinese and Asian biotech companies, EHA 2026 is not merely a platform for learning and observation, but a tangible opportunity to establish a differentiated market position.. With biotech partnering as a key industry backdrop, Over the past two years, an increasing number of Chinese biotech firms have begun presenting their data at EHA, yet most remain in a follower role—replicating targets and mechanisms already validated by Western companies to capture market share through lower costs and faster execution.In 2026, the marginal returns on this strategy are diminishing, necessitating a shift toward a more proactive, differentiated positioning.
Differentiation Opportunity 1: Cost-Control Platforms for ADCs and Bispecific Antibodies.. With biopharma dealmaking as a key industry backdrop, China’s manufacturing capabilities in the field of antibody-drug conjugates (ADCs) have achieved significant scale over the past five years. Companies such as Rongchang Biopharmaceuticals and Kelun Biotech have established manufacturing capabilities in ADC payload synthesis, conjugation chemistry, and quality control systems that are on par with European and American GMP standards, yet at a cost of only 30–50% of that of comparable products in the West.This cost advantage is particularly significant in the European market—European HTA agencies are highly sensitive to treatment costs when conducting cost-effectiveness assessments, and a low-cost manufacturing platform can directly translate into a higher probability of success in Value-Based Payment (VBP) agreements.
Differentiation Opportunity 2: Contribution of data from Chinese multicenter registration trials (MRCTs). In its 2025 revision of the “MRCT Acceptance Policy,” the EMA explicitly states that if Chinese clinical data adhere to uniform GCP standards and a unified molecular testing platform, and can demonstrate biological relevance between the target population and the European population, such data may be accepted as supporting evidence for European NDA applications.This presents a significant regulatory strategy opportunity for Chinese biotech companies: clinical data accumulated domestically can be directly used for European applications once specific conditions are met, eliminating the need to conduct independent clinical trials in Europe from scratch.
Differentiation Opportunity 3: Asia-specific indications for hematological malignancies. The incidence of certain subtypes of hematological malignancies is significantly higher in Asian populations than in Europe (e.g., natural killer/T-cell lymphoma [NK/T-cell lymphoma] and adult T-cell leukemia/lymphoma [ATL]), yet existing drugs approved in Europe have virtually no available data for these subtypes.If Chinese or Asian biotech companies can accumulate sufficient clinical data on these Asia-specific indications and present them at the EHA, they can not only establish academic influence within the European hematology community but also provide support for the registration applications of these products in the Asian market.
Table 4-3: Differentiation Opportunity Matrix for Chinese/Asian Biotech Companies at EHA
| Opportunity Type | Specific Manifestations | Execution Path | Expected Benefits |
| ADC Cost Control | Manufacturing costs are 30–50% of those for comparable products in Europe and the United States | Establish CMO/CDMO partnerships with European ADC companies to share cost savings | Enhance competitiveness under Value-Based Payment (VBP) agreements and gain access to the European market |
| Contribution of MRCT data | The EMA accepts eligible Chinese clinical data | Conduct multi-center studies under unified GCP standards to accumulate data acceptable in Europe | Reduce costs for European NDA submissions and accelerate time to market |
| Asia-specific Indications | Indications with high incidence rates in Asia, such as NK/T-cell lymphoma and ATL | Conduct high-quality clinical studies in China and Japan, and present data at the EHA | Establish academic influence in Europe to support multi-country registrations in Asia |
5.0 Practical Guide: How to Navigate EHA 2026 and bio 2026 Effectively to Capture High-Value Signals
5.1 Agenda Screening Strategy: How to Use ehaweb.org Abstracts to Identify Promising Pipeline Candidates Early

The official EHA 2026 abstracts will be released on ehaweb.org approximately 6–8 weeks prior to the conference, with over 3,000 abstracts going live simultaneously.. With Boston biotech conference as a key industry backdrop, For most attendees, identifying truly valuable signals among these 3,000 abstracts is a highly time-consuming and cognitively demanding task. Below is a proven abstract screening framework that can help you complete 90% of your agenda planning before the conference.
Step 1: Initial screening by technology type (approx. 30 minutes). On the abstract search interface at ehaweb.org, use the following keyword combinations for preliminary screening (we recommend searching each one and compiling the results):
① “in vivo CAR” OR “LNP T cell” OR “mRNA T cell reprogramming” (In Vivo CAR-T related);
② “base editing” OR “prime editing” OR “ABE” OR “CBE” (Base/Prime Editing-related);
③ “ADC” AND (“BCMA” OR “GPRC5D” OR “FcRH5”) (next-generation ADC targets);
④ “bispecific” AND (“GPRC5D” OR “CD22” OR “FcRH5”) (bispecific antibodies targeting new targets);
⑤ “real world” AND (“CAR-T” OR “gene therapy”) (real-world evidence).
After the initial screening, you will typically end up with 200–400 abstracts. This number is still too large, so a second, more refined screening step is necessary.
Step 2: Refine the search by presentation type (approximately 20 minutes). Sort the results from the initial screening by presentation type and prioritize the following three categories (in descending order of importance):
① Late-Breaking Abstract (LBA): This is the EHA’s priority slot for the latest and most important data. With no more than 20–30 LBAs selected annually, this category offers the highest hit rate.
② Oral Presentation: Being selected for an oral presentation means passing the EHA Abstract Committee’s rigorous review and generally represents the top-tier data in the field.
③ Presidential Symposium: The highest-level annual presentation specially invited by the EHA President, typically featuring data that sets the direction for the entire field.
Posters are the most numerous but have the lowest signal-to-noise ratio—not that posters lack value, but given limited time, Oral Presentations and LBAs offer a more certain return on your time investment. The best way to utilize posters is as supplementary validation material for Oral data, rather than as a primary source of information.
Step 3: Create a Personal Observation List (approx. 1 hour). Based on the 50–80 high-value abstracts identified through the above screening process, create your own priority observation list, including: what you will focus on (efficacy data, safety data, or regulatory pathways); what questions you plan to ask the investigators; and your schedule during the conference (Oral and LBA sessions have fixed times, while Posters require visiting the exhibition area during specific time slots).
Table 5-1: Five-Step Screening Framework for EHA Abstracts
| Screening Step | Procedure | Target Number | Time Required | Priority |
| Initial Screening (Technical Keywords) | ehaweb.org keyword search (5 groups) | 200–400 abstracts | Approx. 30 minutes | Complete preliminary scope definition |
| Refined Screening (Presentation Types) | Screening for LBA, Oral, and Presidential Symposium | 50–80 abstracts | Approximately 20 minutes | Identify high-value targets |
| In-depth review and screening of abstracts | Read full texts, highlight key points and questions | 20–30 key summaries | Approx. 3–5 hours | Establish a Knowledge Framework for the Event |
| Schedule planning | Align key summaries with the conference schedule | Complete conference schedule | Approx. 1 hour | Ensure no key Oral/LBA sessions are missed |
| Randomly review posters | Browse randomly by interest, focusing on supplementing Oral data | Randomly browse the venue | 1–2 hours daily | Identify dark horses and conduct additional validation |
5.2 Data Evaluation Techniques: Assessing the authenticity of Poster vs. Oral presentations; avoiding secondary endpoints in PR-hyped data (off-target rates, durability, manufacturing parameters, affordability)
The quality disparity in conference data is far more complex than the simple logic that Oral presentations are superior to Posters. Mastering data discernment is the most critical advanced skill at conferences. Below are several key dimensions for evaluating CGT and hematological/oncology data.
In clinical data, ORR (Objective Response Rate) and CR rate (Complete Response rate) are the most easily PR-manipulated surface metrics, as they reflect early treatment effects and appear particularly impressive when patient follow-up periods are short. The following secondary endpoints are what truly determine long-term value:
① Duration of Response (DOR): The median duration of CR or PR is a more important efficacy metric than the CR rate. A 95% CR rate with a median DOR of only 4 months is far less meaningful than a 70% CR rate with a median DOR of 18 months.
② Off-target rate: Particularly for gene-editing products, assessing the off-target rate requires more than simply determining whether off-target effects exist; it is essential to examine whether the off-target sites are located in functional gene regions and to monitor the dynamic changes in off-target frequency.
③ Manufacturing metrics: What is the product release rate? What is the batch failure rate? What are the proportion and phenotype of CAR-T cells in the final product? These are data points often overlooked in most clinical reports but are critical to commercial viability.
④ Affordability data: In academic reports from 2026, an increasing number of researchers began proactively disclosing manufacturing cost estimates and modeling analyses of payment accessibility.
Table 5-2: Value Hierarchy of CGT Data Metrics for Hematologic Malignancies
| Metric Type | Common Metrics | Risk of Being Deemed PR | Criteria for True Value Assessment |
| Level 1 Surface Indicators | ORR, CR Rate | High (prone to reporting at favorable time points) | Must be evaluated in conjunction with DOR, follow-up duration, and confidence intervals |
| Secondary Value Measures | DOR, PFS, MRD-negative rate | Moderate | The combination of MRD negativity and DOR is currently the optimal combination for predicting treatment efficacy |
| Safety endpoints | Incidence of Grade 3 or higher CRS, incidence of ICANS | Low (full reporting required by regulatory authorities) | Focus on whether CRS is stratified by time of onset (early vs. delayed) |
| Manufacturing/Accessibility Metrics | Manufacturing success rate, product release rate, cost estimates | Low (voluntary disclosure, typically a positive signal) | A manufacturing success rate below 90% is a clear signal of commercialization risk |
| LTFU metrics | Clonal hematopoiesis detection rate, off-target dynamics, secondary tumors | Low (typically, only positive results are reported in the LBA) | The absence of reported secondary tumors does not equate to zero risk; attention must be paid to the completeness of follow-up |
5.3 Networking and Q&A Checklist (The Most Common “Deep” Questions Asked by Investors/BD Professionals)
Hall conversations at EHA often reveal more genuine insights than the formal presentations in the conference halls. Below is a list of targeted questions for different technological areas. These questions are designed with a specific logic: to focus on commercial viability rather than the clinical data itself (since the clinical data is already included in the abstracts; the value of hall conversations lies in uncovering the judgments behind the abstracts).
5.3.1 In Vivo CAR-T: Manufacturing scalability? Off-the-shelf potential? Long-term safety?
① How long does your LNP formulation maintain CAR expression on T cells in vivo? Transient expression (1–2 weeks) vs. sustained expression—which range do your current data fall into?
② Is the in vivo CAR-T manufacturing process reversible (i.e., is there a safety switch mechanism)? If CRS occurs, can CAR expression be immediately terminated?
③ What is the transduction rate of your LNP in hepatocytes? If hepatocytes are transduced, what is the hepatotoxicity management strategy?
④ What is the theoretical manufacturing cost? If validation proceeds smoothly, what is your expected price range for the first indication?
⑤ Can your platform be scaled to an off-the-shelf (allogeneic) setting? Which approach is your primary focus: in vivo reprogramming using T cells from healthy donors versus using the patient’s own T cells?
⑥ How do you plan to address the EMA’s LTFU requirements? Have you designed a monitoring protocol that complies with the EMA’s new guidelines?
5.3.2 Gene Editing: What is the status of LTFU data? How clear is the regulatory pathway?
① What is the longest patient follow-up duration in your study? What is the current HbF level in the patient with the longest follow-up? (Please provide individual patient data; median values alone are not acceptable.)
② What platform is used for clonal hematopoietic monitoring (droplet PCR, WES, or clonal tracking sequencing)? What is the detection sensitivity (can it detect clonal frequencies as low as 0.1%)?
③ Have you identified any off-target sites showing a trend toward amplification during follow-up? If so, are they located in functional gene regions?
④ Regarding the regulatory pathway, have you had formal discussions with the EMA/FDA? Are their requirements for LTFU data integrity consistent with your current protocol?
5.3.3 ADC/Combination Therapies: Ability to expand to earlier treatment lines? Toxicity management?
① Earlier-line expansion plans: Your current indication is relapsed/refractory disease. Do you have clinical designs for first- or second-line indications as the next step? What are the specific patient enrollment criteria?
② Toxicity Management Strategy: In combination therapy, how do you assess the risk of additive toxicity from the ADC’s ocular/hematologic toxicity and that of the other drug? What are your DLT criteria and dose adjustment protocols?
③ Response Duration: Is the MRD-negative rate maintained after 12 months in combination therapy? Do you have an MRD-guided de-escalation strategy?
Table 5-3: Framework for Assessing the Quality of High-Value Questions and Answers in Corridor Discussions
| Question Dimensions | Core Question Directions | Characteristics of a Good Answer | Characteristics of Red-Flag Answers |
| Clinical Feasibility | LTFU Time, MRD Persistence Rate | Includes specific data and is open to discussing individual patient data | Cites only median data from the abstract |
| Safety | Clonal hematopoiesis detection, off-target site dynamics | A systematic monitoring protocol is in place; the platform and sensitivity can be clearly explained | Only states that no issues have been identified to date; no specific monitoring protocol |
| Commercial Viability | Manufacturing Costs, Payment Models | Cost range estimates are available; VBP or phased payment options are being considered | Avoids discussing costs, focusing only on pricing premiums |
| Regulatory Pathway | Status of EMA/FDA communications, LTFU plan | Mature regulatory strategy in place; formal Pre-BLA discussions have already taken place | Only states that the regulatory pathway is clear, with no specific details |
5.4 Special Recommendations for Attendees from China, Singapore, and Asia: How to Align European Data with Local Regulatory and Reimbursement Environments
For attendees from mainland China, Hong Kong, Singapore, and other Asian regions, EHA 2026 offers several practical recommendations worthy of special attention. These recommendations are based on the unique challenges and opportunities faced by Asian biotech companies in the European market.
Recommendation 1: Proactively identify China-friendly signals from the EMA’s consultation window. In recent years, the EMA’s stance on promoting the acceptance of MRCT data has become noticeably more open. During EHA 2026, we recommend setting aside dedicated time to attend the Regulatory Session featuring EMA representatives (typically held on the morning of the second or third day) to record the EMA’s latest statements regarding the acceptance of Chinese data. This approach is far more actionable than relying on any secondhand reports.
Recommendation 2: Analyze European data in conjunction with local regulatory and reimbursement environments. China’s National Medical Products Administration (NMPA) is rapidly aligning its CGT regulations with international standards but still retains several country-specific requirements. When reviewing European data at EHA, make it a habit to ask yourself: Which NMPA requirements does this dataset meet? What is still missing? This dual-track analytical framework is key to maximizing the value of European conferences.
Recommendation 3: Leverage the KOL network within the Nordic healthcare system. Hematology Key Opinion Leaders (KOLs) in the Nordic region—particularly in Sweden and Denmark—exert academic influence in the European CGT field far exceeding the size of their respective countries. The CGT team at Karolinska University Hospital maintains long-standing collaborative relationships with several top-tier Chinese hematology centers (including Beijing 301 Hospital and the Shanghai Institute of Hematology).The EHA is the ideal venue to activate this KOL network. Preparing a one-pager in advance that highlights the value of Chinese data and proactively distributing it during appropriate poster sessions often serves as the starting point for long-term collaboration.
Recommendation 4: Establish data integration with CRO service providers such as Genio. For CROs (such as Genio Bio) offering preclinical pharmacodynamic research services in the field of hematological oncology, EHA 2026 presents an excellent opportunity to demonstrate the alignment of their services with cutting-edge technological trends.Pay close attention to in vitro T-cell activation and in vivo efficacy assessment models used in in vivo CAR-T research, as well as hematopoietic stem cell editing efficiency evaluation systems used in Base/Prime Editing product development—these represent the core entry points for precision CRO services.

6.0 bio 2026 Conclusion: The Second Half of the Golden Age of Hematology — Defining Success Through Scalable Accessibility
6.1 Key Milestone Tracking List for the Next 12–18 Months
Following EHA 2026, the next 12–18 months will be a critical window for these technological directions to truly diverge. Below is a checklist of key milestones compiled based on the analytical framework presented in this paper. We recommend that attendees and industry observers mark these dates on their calendars for ongoing tracking.
Table 6-1: Key Milestone Tracking List for 2026–2027
| Technology Direction | Key Milestone | Expected Timeline | Importance Note |
| In Vivo CAR-T | First-in-Human (FIH) Safety Data (University of Pennsylvania/Dana-Farber) | EHA 2026 (June) | Assess in vivo transfection safety benchmarks |
| In Vivo CAR-T | 12-Month Extended Cohort Safety Data | First half of 2027 (AACR/ASH) | Confirmation of tolerability and preliminary efficacy signals |
| Base Editing (BEAM-101) | 3-Year Long-Term Follow-Up (LTFU) Data for Sickle Cell Disease | EHA 2026/ASH 2026 | Key LTFU Safety Milestone |
| Regulatory | Final Draft of FDA Guidelines on Allogeneic Cell Therapy | Q3–Q4 2026 | Off-the-shelf regulatory framework finalized |
| Regulatory | Implementation of EMA’s New ATMP Guidelines | October 2026 | Impact on pending ATMP applications in Europe |
| Commercial | Results of BMS’s Breyanzi VBP in the Netherlands | Q4 2026 | Results of the first CAR-T VBP agreement announced |
| ADC | GPRC5D-ADC Key Phase 2 Data | ASH 2026 (December) | First Large-Scale Data for Next-Generation Hematologic ADC Target |
| China Biotech | EMA Accepts Chinese MRCT Data; Policy Officially Takes Effect | Second Half of 2026 | Policy Window for European Acceptance of Chinese Data |
Among the milestones listed above, three warrant particular attention: the in vivo FIH data at EHA 2026 (the first human evidence to assess the feasibility of next-generation technology), the base editing LTFU data at ASH 2026 (a critical indicator of whether the regulatory pathway is smooth), and the BMS VBP results in the Netherlands (practical validation of whether the CAR-T business model can truly take hold in Europe).These three data points will, to a significant extent, determine the capital flows and industry landscape of the global CGT sector in 2027–2028.
6.2 Direct Implications for Clinical Practice, R&D Pipelines, and Investment Decisions
Summarizing all the analyses in this article, the following directly actionable insights can be distilled for different reader groups.
For Clinicians: The logic behind treatment selection in 2026 needs to shift from prioritizing best efficacy to balancing optimal efficacy, accessibility, and safety.For patients with limited financial resources, bispecific antibodies (such as Teclistamab and Glofitamab) already offer short- to medium-term efficacy comparable to CAR-T in certain indications, with significantly lower costs and greater convenience of administration than autologous CAR-T. For patients eligible to participate in clinical trials, early-stage trials of In Vivo CAR-T represent one of the most promising clinical research directions for 2026–2027.
To R&D leaders: Now is the most critical time to assess the timing of a strategic shift. If your company still relies on autologous CAR-T as its core pipeline, the 2026 EHA data will provide a very clear signal: if the safety data from the in vivo first-in-human (FIH) trial meets expectations, the window for new investments in autologous CAR-T will narrow significantly within 18 to 24 months; if the data falls short of expectations, autologous CAR-T will still have a 3- to 5-year window.Regardless of the outcome, making data-driven strategic decisions is far superior to remaining stuck in a state of uncertainty.
For investors: The period from the second half of 2026 to 2027 will mark a watershed moment for CGT investments. Delivery platform companies (LNP-targeted T cells/HSCs) currently represent the sub-sector with the highest risk-adjusted expected returns, for the following reasons: genuine technical barriers exist, market demand is highly certain, and the sector has not yet entered a highly competitive red ocean.Base/Prime Editing is the second priority, provided that no major safety signals emerge from LFTU data at EHA and ASH. Autologous CAR-T companies will continue to face valuation pressure unless they have a clear cost-control strategy (such as switching to off-the-shelf or in vivo approaches).
To Chinese BD leads: 2026 represents the optimal window for establishing European partnerships for three reasons: the EMA’s MRCT policy is becoming more open; the value of European RWE databases is gaining full recognition; and the Nordic KOL network remains in a relatively accessible, early-stage collaboration phase.It is recommended that during EHA 2026, the focus be on identifying 3–5 European institutions or companies with strengths in delivery platforms or LTFU data, initiating informal BD outreach, and laying the groundwork for formal partnership negotiations in 2027.
Table 6-2: Direct Insights and Action Recommendations for Different Audiences
| Reader Type | Key Insights | Recommended Actions for 2026 | Review Point in 12 Months |
| Clinicians | Balancing Efficacy, Accessibility, and Safety to Select Treatment | Monitor enrollment data from the In Vivo FIH trial | 12-month safety data from the in vivo CAR-T trial |
| Head of R&D | Determining the Timing of a Technology Pathway Shift Based on EHA Data | Conduct a detailed evaluation of in vivo FIH data at EHA | ASH 2026 LTFU Data |
| Investors | Delivery Platform > Base/Prime Editing > Autologous CAR-T | Investing in LNP-targeted platform companies (Series A/B rounds) | BMS VBP Results in the Netherlands, Final Draft of Regulatory Guidelines |
| China BD Lead | MRCT Policy Window, KOL Collaboration Opportunities in Northern Europe | EHA Identifies 3–5 Target Partner Institutions | EMA MRCT Policy Officially Takes Effect (Q3–Q4) |
6.3 Elevating Core Principles: Truly great innovation is no longer just about pushing cure rates to new heights, but about making breakthrough therapies affordable and accessible routine options for ordinary patients
In 2026, the global field of hematology is undergoing a profound shift in values. The era of pushing cure rates to the limit, driving prices to the ceiling, and leaving accessibility for later has completed its historical mission, as evidenced by Bluebird Bio’s delisting notice and 2seventy bio’s downsizing announcement.
Replacing it is a simpler yet more challenging ideal: making breakthrough therapies affordable and accessible routine treatment options for ordinary patients.This is not merely a slogan, but a systemic endeavor that requires simultaneous progress in technological breakthroughs, business innovation, and regulatory collaboration. In Vivo CAR-T aims to address manufacturing costs, VBP agreements seek to resolve payment pathways, and the EMA’s CMA mechanism tackles regulatory timelines. These three approaches are all working toward the same core objective: narrowing the gap between effective treatment and accessible treatment.
EHA 2026 will reveal how far we’ve come on this path—and how far we still have to go. The truly good news isn’t that a particular product achieved a 95% complete remission (CR) rate in 85 patients, but that a product has demonstrated clinical viability at a manufacturing cost of $30,000, making this treatment accessible to a child from a working-class family. That is the news truly worth anticipating and celebrating.
Stockholm awaits the answers.
7.0. bio 2026 Frequently Asked Questions (FAQ)

Q1: Where and when will the EHA 2026 conference be held?
EHA 2026 (the 2026 Annual Congress of the European Hematology Association) will be held in Stockholm, Sweden, in June 2026.
EHA is one of the world’s two premier annual hematology conferences, often referred to alongside ASH (the American Society of Hematology Annual Meeting) held in December as the “twin peaks” of the field. Each year, it attracts hematologists, clinicians, R&D experts, and investors from over 100 countries worldwide.
Q2: What is In Vivo CAR-T technology? How does it differ from traditional CAR-T?
The manufacturing process for traditional CAR-T (ex vivo autologous CAR-T) involves: collecting T cells from the patient → modifying and processing them ex vivo → returning them to the patient after quality control. The entire process takes 3–6 weeks and costs over $500,000.
In Vivo CAR-T (in vivo CAR-T), on the other hand, bypasses the in vitro manufacturing step by directly injecting mRNA carrying the CAR construct into the patient via LNP (lipid nanoparticles), thereby modifying T cells directly within the patient’s body.
If clinically feasible, this approach could reduce manufacturing costs by over 90%, giving more patients the opportunity to receive treatment.
Q3: Is Base Editing safer than traditional CRISPR-Cas9?
From a technical standpoint, the safety advantages of Base Editing are well-founded. Traditional CRISPR-Cas9 generates double-strand breaks (DSBs), which trigger cellular DNA damage stress and may lead to chromosomal rearrangements, large-scale deletions, and clonal selection pressure.
Base editing directly converts target bases through chemical modification without generating DSBs, theoretically offering higher genomic stability.
However, conclusions regarding safety require validation through long-term follow-up (LTFU) data—only the absence of secondary tumors or clonal hematopoietic progression over a 10-year period can provide definitive evidence.
The 2026 EHA will present 3–5-year follow-up data for multiple base editing products, which will constitute the most significant body of safety evidence to date.
Q4: How can Chinese biotech companies leverage EHA 2026 to expand into the European market?
There are three actionable pathways for Chinese biotech companies to participate in EHA:
① Present high-quality domestic ADC/bispecific antibody data in the EHA Poster Session to build awareness within the European hematology community;
② Identify data compliance pathways aligned with EMA MRCT policies to accumulate compliant supporting data for future European NDA applications;
③ Establish informal collaborative contacts with Nordic KOLs (such as Karolinska University Hospital), prioritizing academic collaboration to build a foundation of trust for subsequent business development negotiations.
In recent years, the EMA’s stance toward accepting Chinese MRCT data has become significantly more open, and 2026 represents a policy window with relatively low barriers to entry into the European market.
Q5: What are the three key highlights to watch for at EHA 2026?
Based on the in-depth analysis in this article, the three key highlights to watch at EHA 2026 are:
① First-in-human (FIH) safety data for in vivo CAR-T—this will serve as the first human evidence to assess the commercial viability of next-generation technologies;
② 3–5-year long-term follow-up (LTFU) data on Base/Prime Editing—including clonal hematopoietic detection rates and dynamic changes in off-target sites—which will directly influence the clarity of the regulatory pathway;
③ Data on next-generation ADCs (targeting GPRC5D, FcRH5) and combination regimens with bispecific antibodies—this represents the latest clinical efforts to find the optimal combination between CAR-T and ADCs, and is the technology direction with the fastest commercialization timeline for 2026–2028.